home values
Single Family Construction has risen to an 8-year high, NAHB forecasts continued Acceleration!
INFO THAT HITS US WHERE WE LIVE…Home builders are building plenty of doors, sending single family construction spending up 2.1% in July over June, and up 15.8% over a year ago. In fact, single family spending was the leading driver of total private residential construction spending in July. Single family starts rose 12.9% to a 782,000 annual rate, an 8-year high and the National Association of Home Builders (NAHB) is forecasting single family spending will accelerate through the rest of this year. The NAHB’s chairman noted, “Our builders are reporting more confidence in the market and are stepping up production of single family homes as a result.”
The Fed’s latest Beige Book on economic conditions told us home sales and home prices headed up in all 12 Federal Reserve Districts. But construction activity was mixed and inventories continue to decline or stay flat. However, the overall residential outlook was positive, with the majority of Districts expecting the increased residential activity to continue. Freddie Mac’s August Insight & Outlook report says that 2015 should be the best year yet, as their annual home sales projection soared to 5.73 units. The Mortgage Bankers Association’s Weekly Applications Survey pegged their Purchase Index at its highest level since July, and 25% higher than a year ago.
SUMMER’S OVER… No one comes to Wall Street for fun in the sun, but everyone has a good time watching their investments go up. Traders enjoyed that sort of entertainment for most of the warm season, but the week before Labor Day the summer fun ended. The five-day roller coaster ride ended with the three major stock indexes posting their second largest weekly losses of the year. China’s economic slowdown didn’t help, but Friday’s jobs report sent stocks down with a thud. The 173,000 new Nonfarm Payrolls for August was on the low side, but good Hourly Earnings growth and a 5.1% Unemployment Rate may encourage the Fed to raise rates later this month.
However, those central bankers may want to take a closer look at this economic recovery. The ISM manufacturing index slipped to 51.1 in August, still signaling expansion above 50, but just barely. The ISM services index was way higher, at 59.0, though that too had slipped for the month. But let’s get positive. Productivity increased at a 3.3% annual rate in the second quarter, a nice upward revision from the prior 1.3% estimate. Initial Unemployment Claims have now come in under 300,000 for 31 weeks in a row, while Continuing Unemployment Claims dropped to 2.27 million. But the July Trade Deficit was $41.9 billion, $7.9 billion bigger than a year ago. Ugh.
The week ended with the Dow down 3.2%, to 16102; the S&P 500 down 3.4%, to 1921; and the Nasdaq down 3.0%, to 4684.
Stocks may have tanked, but bonds only had an OK week, thanks to investor concerns over a Fed rate hike in September. The 30YR FNMA 4.0% bond we watch finished the week up .04, at $106.15. Freddie Mac’s Primary Mortgage Market Survey for the week ending September 3 showed national average fixed mortgage rates up a tick. This was put to “another week with lots of volatility on essentially no new information.” Remember, mortgage rates can be extremely volatile, so check with your mortgage professional for up to the minute information.
DID YOU KNOW?… In their August Insight & Outlook report, Freddie Mac increased their mortgage originations estimate for 2015 to $1.45 trillion.
>> This Week’s Forecast
JOBLESS CLAIMS UNDER CONTROL, JUST LIKE WHOLESALE PRICES… Not much to look after during our first week back from the summer. The four days will have us checking if Initial Unemployment Claims remain under the 300,000 threshold. Analysts predict they will. The Producer Price Index (PPI) is forecast to show wholesale price inflation is also under control, contracting in August. If this keeps consumer prices down, the Fed may delay hiking rates, as they first want to see inflation up around 2%.
All financial markets were closed Monday September 7 for the Labor Day holiday.
>> The Week’s Economic Indicator Calendar
Weaker than expected economic data tends to send bond prices up and interest rates down, while positive data points to lower bond prices and rising loan rates.
Economic Calendar for the Week of Sep 7 – Sep 11
| Date | Time (ET) | Release | For | Consensus | Prior | Impact |
| Th Sep 10 |
08:30 | Initial Unemployment Claims | 9/5 | 275K | 282K | Moderate |
| Th Sep 10 |
08:30 | Continuing Unemployment Claims | 8/29 | 2.257M | 2.257M | Moderate |
| Th Sep 10 |
11:00 | Crude Inventories | 9/5 | NA | 4.670M | Moderate |
| F Sep 11 |
08:30 | Producer Price Index (PPI) | Aug | -0.1% | 0.2% | Moderate |
| F Sep 11 |
08:30 | Core PPI | Aug | 0.1% | 0.3% | Moderate |
| F Sep 11 |
10:00 | Univ. of Michigan Consumer Sentiment | Sep | 91.5 | 91.9 | Moderate |
| F Sep 11 |
14:00 | Federal Budget | Aug | NAB | -$128.7B | Moderate |
>> Federal Reserve Watch
Forecasting Federal Reserve policy changes in coming months… A majority of economists see a rate hike in December, while those predicting a September or October hike remain in the minority. Note: In the lower chart, a 19% probability of change is an 81% certainty the rate will stay the same.
Current Fed Funds Rate: 0%–0.25%
| After FOMC meeting on: | Consensus |
| Sep 17 | 0.00%-0.25% |
| Oct 28 | 0.00%-0.25% |
| Dec 16 | 0.25%-0.50% |
Probability of change from current policy:
| After FOMC meeting on: | Consensus |
| Sep 17 | 19% |
| Oct 28 | 36% |
| Dec 16 | 53% |
New Home Sales Avg. Fastest Sales Pace Since 2008 but China’s Economy and Interest Rates A Concern!
We certainly need no lengthy explanations concerning what’s doing in the new home market. In July new single-family home sales headed up 5.3%, to a 507,000 unit annual rate, and are now up 25.8% over a year ago. These sales cooled off in June, but looking at the past year, new home sales averaged their fastest sales pace since 2008. Consequently, inventories gained by 4,000, yet the months’ supply dropped from 5.3 in June to 5.2 in July. That faster selling pace gives builders a nice opportunity to step up construction activity and inventories. Remember, new home sales are still well below historic levels.
Meanwhile, the Case-Shiller Home Price index edged up 1.0% in June and now stands 4.5% ahead of a year ago. Prices are up in all 20 major metro areas the index tracks. The Federal Housing Finance Agency (FHFA) index of prices for homes financed with conforming mortgages went up 0.2% in June and registered a 4.5% hike over a year ago. For those questioning existing home sales, what Pending Home Sales did in July provided a nice short answer. This measure of contracts signed on existing homes went up 0.5% for the month, following its 1.7% dip in June. That dip means existing home sales may slip in August, but they gained almost 10% the three prior months.
Check this out. The Dow Jones Industrial Average drops almost 600 points Monday, then sinks another 34 Tuesday. Wednesday it shoots UP over 600 points, followed by an almost 400 point hike on Thursday. Friday ends flat after all the tumult, leaving a modest weekly gain for the Dow and the broadly based S&P 500, but a bigger boost for the tech-heavy Nasdaq. What caused this whirlwind of volatility? Analysts put it to investor uncertainty about China’s troubled economy, plus worries over when the Fed might start raising interest rates. The central bankers met at Jackson Hole, but comments from officials were hard to interpret.
U.S. economic data painted the now familiar picture of a plodding recovery. Positive moves included the housing reports covered above and a 2% gain in Durable Goods Orders for July. The best news was the second estimate of GDP for the second quarter, which had the economy growing at a 3.7% annual rate. Personal Income and Spending were up in July, both good reads, and Core PCE Prices went up just 0.1%. This is bad news to the Fed, which wants to see higher inflation before raising rates. University of Michigan Consumer Sentiment slipped in July, but this contrasted sharply with the Consumer Confidence Index, which hit a 6-month high in August!
The week ended with the Dow UP 1.1%, to 16643; the S&P 500 UP 0.9%, to 1989; and the Nasdaq UP 2.6%, to 4828.
Bonds had a mixed week, with investors buying because of worries over China and selling over concerns a Fed rate hike will come soon. The 30YR FNMA 4.0% bond we watch finished the week down .05, at $106.11. National average fixed mortgage rates dipped to their lowest levels since May in Freddie Mac’s Primary Mortgage Market Survey for the week ending August 27. This was put to Chinese financial market instability. Remember, mortgage rates can be extremely volatile, so check with your mortgage professional for up to the minute information.
DID YOU KNOW?… A recent survey reports that out of 75.3 million millennials, age 18 to 29, 93% want to own a home in the near future.
Weaker than expected economic data tends to send bond prices up and interest rates down, while positive data points to lower bond prices and rising loan rates.
Economic Calendar for the Week of Aug 31 – Sep 4
| Date | Time (ET) | Release | For | Consensus | Prior | Impact |
| M Aug 31 |
09:45 | Chicago PMI | Aug | 54.7 | 54.7 | HIGH |
| Tu Sep 1 |
10:00 | ISM Index | Aug | 52.6 | 52.7 | HIGH |
| W Sep 2 |
08:30 | Productivity-Rev. | Q2 | 2.7% | 1.3% | Moderate |
| W Sep 2 |
08:30 | Unit Labor Costs-Rev. | Q2 | -0.8% | 0.5% | Moderate |
| W Sep 2 |
10:30 | Crude Inventories | 8/29 | NA | -5.452M | Moderate |
| W Sep 2 |
14:00 | Fed’s Beige Book | Sep | NA | NA | Moderate |
| Th Sep 3 |
08:30 | Initial Unemployment Claims | 8/29 | 273K | 271K | Moderate |
| Th Sep 3 |
08:30 | Continuing Unemployment Claims | 8/25 | 2.261M | 2.269M | Moderate |
| Th Sep 3 |
08:30 | Trade Balance | Jul | -$43.1B | -$43.8B | Moderate |
| Th Sep 3 |
10:00 | ISM Services | Aug | 58.4 | 60.3 | Moderate |
| F Sep 4 |
08:30 | Average Workweek | Aug | 34.6 | 34.6 | HIGH |
| F Sep 4 |
08:30 | Hourly Earnings | Aug | 0.2% | 0.2% | HIGH |
| F Sep 4 |
08:30 | Nonfarm Payrolls | Aug | 217K | 215K | HIGH |
| F Sep 4 |
08:30 | Unemployment Rate | Aug | 5.2% | 5.3% | HIGH |
>> Federal Reserve Watch
Forecasting Federal Reserve policy changes in coming months… A growing minority of economists see a rate hike in September or October, while a slim majority expect it in December. Note: In the lower chart, a 28% probability of change is a 72% certainty the rate will stay the same.
Homeownership as an Investment: The Role of Price Appreciation
We recently posted on the results from the latest Home Price Expectation Survey(HPES) showing where residential home prices are headed over the next five years. Today, we want to show you what the results of the report could mean to you.
A good portion of every family’s wealth comes from the equity in the home they live in. As the value of their home (an asset) increases so does their equity. Let’s look at a possible case scenario based on the latest HPES.
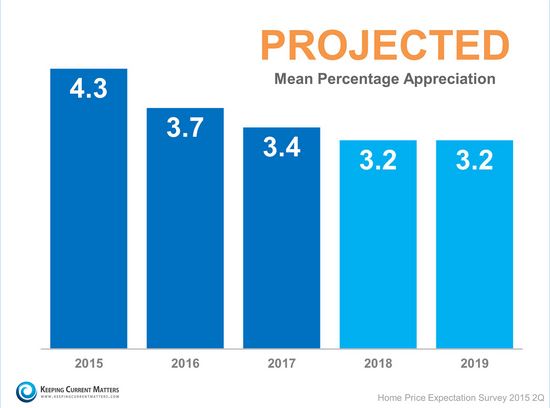
Here is a chart showing the survey’s projections on annual appreciation over the next five years:
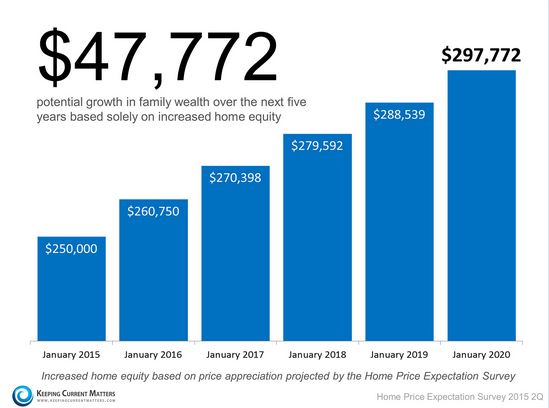
We then looked at the five-year impact this would have on the equity of a family that purchased a home in January for $250,000:
Their family wealth (based on increased equity) would increase by $47,772 over those five years.
Bottom Line
If you don’t yet own, perhaps you should be…
View original post 127 more words
Existing Homes Sales posted an upside surprise, coming in at a 5.59 million annual rate, hitting their fastest sales pace in eight years.
No one would call today’s housing market a raging success, but it is moving ahead pretty well, considering. Housing Starts went up nicely in July, hitting a 1.206 million annual rate, and they’re now up 10.1% over a year ago. The month’s gain all came from a 12.8% hike in single-family units, which are up 19.0% in the last 12 months. Notably, this performance followed the boom in starts reported in June. Building Permits, however, were down in July, dipping to a 1.119 million annual rate. Yet single-family permits are up 6.1% and multi-family permits up 9.7% compared to a year ago.
Sales of previously owned homes also went ahead nicely in July. In fact, Existing Homes Sales posted an upside surprise, coming in at a 5.59 million annual rate, hitting their fastest sales pace in eight years. This was the third month in a row sales rose. They’ve also been up five of the last six months and have scored year-over-year increases for ten consecutive months. Of course, tight supply and rising prices could slow things down, but more inventory should come to market in the coming year, as sellers who were on the fence jump in to grab those price gains amidst strong buyer demand. Total existing home sales are now up 10.3% versus a year ago.
Stocks sank heavily on Friday, their biggest plunge in a week of heavy selling that sent the Dow Jones Industrial Average to a level seen as a correction. The blue chip index sank 5.8% for the week, winding up more than 10% below its record close in May, which is the widely accepted definition of a correction. The S&P 500 and the Nasdaq suffered their worst weekly drops in four years. Many saw this as profit taking by market technicians, but others worried about China’s softening economy and weaker global economic growth, valid concerns in today’s interconnected world. These pressures could also delay the Fed’s interest rate hike til year end.
The U.S. economy actually wasn’t looking too bad. In addition to the very fine housing data reported above, real (meaning inflation-adjusted) hourly earnings are up 1.9% in the last year, while real weekly earnings are up 2.2%. The Consumer Price Index (CPI) for July revealed core prices (excluding volatile food and energy) remain close to the Fed’s 2% inflation target. The Philadelphia Fed Index showed stronger manufacturing activity in that region, but the New York Empire Index came in with its lowest reading since April 2009. Initial jobless claims were up a bit yet under 300,000 for the 24th week in a row, while continuing claims dropped to 2.254 million.
The week ended with the Dow down 5.8%, to 16460; the S&P 500 down 5.8%, to 1971; and the Nasdaq down 6.8%, to 4706.
While stock indexes around the world were making multi-month lows, money flowed into U.S. bonds, pushing prices up nicely. The 30YR FNMA 4.0% bond we watch finished the week UP .85, to $106.16. Freddie Mac’s Primary Mortgage Market Survey for the week ending August 20 showed national average fixed mortgage rates largely unchanged. Rates have remained at very attractive levels now for five weeks straight. Remember, mortgage rates can be extremely volatile, so check with your mortgage professional for up to the minute information.
Federal Reserve Watch
Forecasting Federal Reserve policy changes in coming months… Last week’s release of the minutes from the Fed’s last meeting gave no clear signal for when a rate hike may begin. December now looks likely to many economists. Note: In the lower chart, a 28% probability of change is a 72% certainty the rate will stay the same.
Improvements You Can Make To Your Home To Add Value

If you are planning to sell your house in the future, it might be a good idea to fix things up a bit so that potential buyers will view it more favorably. Better impressions translate to higher valuations. Here are the most effective ways to increase home value:
Kitchen Remodeling
Many real estate agents go straight to the kitchen when evaluating a house. They know that buyers will be very critical about this space so they need to see if it is any good. All the flaws found will cause the price of the house to plummet. Discolored walls, busted pipes, peeling paint, oil stains, broken faucets, and other issues should be fixed right away. Make the space look fresher by giving the walls a new coat. Replace the shelves and cabinets or even refinish them for a new glow.
Front Yard Enhancement
The front yard is the first thing…
View original post 198 more words


