
@huntley360
Is Fall The Best Time To Buy A House?
If you’re serious about buying a home, fall might be the perfect time of year to make it happen. But it has a particular set of challenges too. READ MORE
Ready to Sell Your Home? Ready to Buy? Search for Homes for sale in Columbia, South Carolina & Search for Homes for sale in Lexington and Lake Murray, South Carolina
What Do You Really Need to Qualify for a Mortgage?

It appears that Millennials are finally beginning to enter the housing market. In a recent report, CoreLogic looked at the annual net change in household formations over the last decade (see graph below):
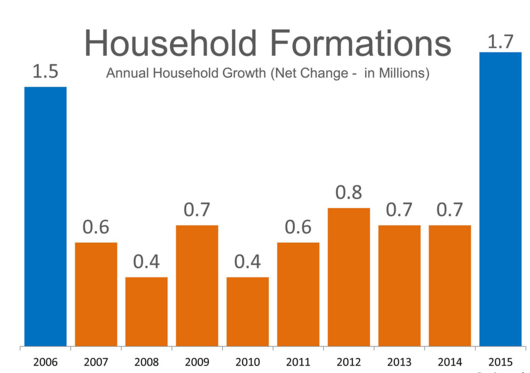
It appears this is the year that Millennials are finally moving out of their parents’ basements and finding a place of their own. And they are not all renting
According to the National Association of Realtors’ latest Existing Home Sales Report, the percentage of first–time buyers rebounded to 32 percent in August, up from 28 percent in July and matching the highest share of the year set in May.
What has kept the others from buying a home?
Recent surveys have revealed that there are major misunderstandings as to what is required to get a mortgage in today’s lending environment. Many Americans believe you need at least a 780 FICO score and a 20% down…
View original post 172 more words
THE FED HOLDS, STOCKS FOLD! SINGLE FAMILY BUILDING PERMITS HIGHEST SINCE 2008.
INFO THAT HITS US WHERE WE LIVE… Some people felt there was really nothing to say after Housing Starts dropped 3.0% in August, to a 1.126 million annual rate. But, as usual, a deeper dive into the data gives us plenty to talk about. While it’s obvious that home building took a summer break in August, it’s been pretty active the last 12 months, with starts in that period up 14.9% for single-family units and up 16.6% overall. Some see that trend continuing at least through the end of 2016. They say that with population growth and tear downs, housing starts need to get to about 1.5 million units annually, so there’s lots of recovery still to come.
We could get there sooner than some think, since new building permits went up 3.5% in August, climbing to a 1.170 million yearly rate. In fact, single-family permits are now at their highest level since January 2008. No wonder the National Association of Home Builders confidence index reached its best reading since October 2005. Before the Fed left rates unchanged on Thursday, Freddie Mac’s chief economist said, “Even if the Fed decides to raise short-term interest rates, we don’t expect a significant impact on the housing market.” A good thought to remember whenever the Fed finally hikes rates. He added: “We’re still on track for the best year of home sales since 2007.”
THE FED HOLDS, STOCKS FOLD… Regular Inside Lending readers weren’t surprised by the Fed’s decision last week to hold rates down. Our prior edition pegged the probability of a rate hike at just 23%. The mass media felt otherwise, hinting rates would likely go up at Thursday’s meeting. This was strange, as the probabilities we report come from public sources respected by many economists. After the Fed’s rate hold, stocks folded, as the Dow fell 290 points Friday, leaving it and the S&P 500 down for the week and the Nasdaq barely ahead. This was blamed on the Fed’s doubts about U.S. and global economic strength, but Friday was also a volatile quarterly “quadruple witching” day.
Some analysts see the current stock downturn as purely a technical correction, driven by investors taking profits after a long bull market run. These folks point out that although the economy is far from booming, it is making progress, if ever so slowly. One aspect of that progress was the 0.2% gain for Retail Sales in August. Unfortunately, the manufacturing sector didn’t fare as well, with Industrial Production, Capacity Utilization, the New York Empire and Philadelphia Fed Indexes all posting declines. On the other hand, Initial Unemployment Claims dipped to their lowest level in two months, while Continuing Unemployment Claims fell to 2.237 million.
The week ended with the Dow down 0.3%, to 16385; the S&P 500 down 0.2%, to 1958; and the Nasdaq UP 0.1%, to 4827.
Bonds did well, strongly rallying as global stock markets and oil prices suffered steep declines. The 30YR FNMA 4.0% bond we watch finished the week UP .12, to $106.20. Freddie Mac’s Primary Mortgage Market Survey for the week ending September 17 showed national average fixed mortgage rates largely unchanged. Remember, mortgage rates can be extremely volatile, so check with your mortgage professional for up to the minute information.
DID YOU KNOW?…”Quadruple witching” day is when stock index futures, stock index options, stock options, and single stock futures all expire. Since investors must close out of their positions, there’s usually high volatility and trading volumes. It’s the third Friday of the last month of each quarter.
This Week’s Forecast
HOME SALES UP AND DOWN, BUSINESS INVESTMENT OFF, ECONOMY GROWS… The typically mixed bag of economic data includes August Existing Home Sales, forecast a bit down, and New Home Sales, a bit up. Durable Goods Orders should show business investment slightly on the wane, yet the GDP – 3rd Estimate is expected to report economic growth holding at 3.7%.
>> The Week’s Economic Indicator Calendar
Weaker than expected economic data tends to send bond prices up and interest rates down, while positive data points to lower bond prices and rising loan rates.
Economic Calendar for the Week of Sep 21 – Sep 25
| Date | Time (ET) | Release | For | Consensus | Prior | Impact |
| M Sep 21 |
10:00 | Existing Home Sales | Aug | 5.50M | 5.59M | Moderate |
| W Sep 23 |
10:30 | Crude Inventories | 9/19 | NA | -2.104M | Moderate |
| Th Sep 24 |
08:30 | Initial Unemployment Claims | 9/19 | 271K | 264K | Moderate |
| Th Sep 24 |
08:30 | Continuing Unemployment Claims | 9/12 | 2.248M | 2.237M | Moderate |
| Th Sep 24 |
08:30 | Durable Goods Orders | Aug | -2.0% | 2.2% | Moderate |
| Th Sep 24 |
10:00 | New Home Sales | Aug | 515K | 507K | Moderate |
| F Sep 25 |
08:30 | GDP – 3rd Estimate | Q2 | 3.7% | 3.7% | Moderate |
| F Sep 25 |
08:30 | GDP Deflator – 3rd Est. | Q2 | 2.1% | 2.1% | Moderate |
| F Sep 25 |
10:00 | U. of Michigan Consumer Sentiment – Final | Sep | 87.0 | 85.7 | Moderate |
Federal Reserve Watch
Forecasting Federal Reserve policy changes in coming months…The Fed’s move last week to leave the Funds Rate unchanged has led most economists to think we won’t see a hike now til next year. Note: In the lower chart, an 11% probability of change is an 89% certainty the rate will stay the same.
Current Fed Funds Rate: 0%–0.25%
| After FOMC meeting on: | Consensus |
| Oct 28 | 0.00%-0.25% |
| Dec 16 | 0.00%-0.25% |
| Jan 27 | 0.00%-0.25% |
Probability of change from current policy:
| After FOMC meeting on: | Consensus |
| Oct 28 | 11% |
| Dec 16 | 39% |
| Jan 27 | 49% |
NEW LISTING!!! 409 CLEARVIEW AVE. WAUCONDA, IL 60084

409 CLEARVIEW, WAUCONDA, IL
$219,900 – 4 BEDROOM – 2 BATH – 1882 SQUARE FEET – BANGS LAKE


THIS CAPE COD HOME WILL GIVE YOU THE LIFESTYLE YOU’VE BEEN DESIRING. BRING YOUR TOYS! JUST 2 BLOCKS FROM #BANGSLAKE FOR BOATING, FISHING AND BEACH AND NEAR FOREST PRESERVE TO SNOWMOBILE OR HIKE ON THE TRAILS. ALL WITHIN A WALK. 1882 SQUARE FEET WITH 4 BEDROOMS,


THIS HOME HAS HAD TONS OF UPDATES WITHIN THE LAST 10 YEARS. 2-ZONE HEATING AND AIR, UPDATED COUNTERTOPS AND MAPLE CABINETS, 200 AMP SERVICE, GROHE AND MOEN FAUCETS THROUGHOUT. LARGE BACKYARD FEATURES A DOUBLE CEDAR GATE TO KEEP YOUR BOAT AND YOUR OTHER TOYS SAFE! THE YARD ALSO FEATURES A SHED AND THE OPPORTUNITY TO HAVE A NICE BACKYARD PARTY OR JUST RELAX ON THE PATIO.

MAIN FLOOR FEATURES A WOOD BURNING STOVE. NICE SIZED BEDROOMS. NEIGHBORHOOD IS APPEALING TO FAMILIES WITH CHILDREN TOO WITH PLENTY TO DO!! PART OF THE ROOF REPLACED JUST 3 YEARS AGO.

Open House – 2127 Serenity Ln., Woodstock, IL 60098. 11-2p.m. Saturday, September 19th
$199,900. PONDS OF BULL VALLEY – 3 CAR GARAGE –
3 BEDROOM – 2.5 BATH – 1654 SQ. FT. – LARGE MASTER SUITE

GREAT HOME AT A GREAT PRICE IN A GREAT LOCATION IN THE PONDS OF BULL VALLEY!!! SIT AND RELAX ON THE DECK OVERLOOKING LARGE OPEN AREA AND WOODS. PERFECT PLACE TO RELAX AND ENJOY ALL THE WONDER AND BEAUTY OF GOD’S GREAT CREATION!!! KITCHEN OPENS INTO THE LIVING ROOM WITH WOODBURNING FIREPLACE SO YOU CAN COOK AND/OR EAT AND WATCH YOUR FAVORITE TV PROGRAMS,

LARGE MASTER SUITE W/WALKIN CLOSET AND PRIVATE BATH IS PERFECT GETAWAY AFTER A LONG DAY AT WORK. 2ND FLOOR LOFT IS IDEAL FOR AT HOME OFFICE, COMPUTER AREA OR CHILDREN’S VIDEO GAMES!

FULL UNFINISHED ENGLISH BASEMENT IS PERFECT FOR ALL YOUR STORAGE NEEDS OR TO FINISH OFF AND ADD EVEN MORE LIVING SPACE. YOU WILL LOVE THE 3 CAR GARAGE FOR ALL YOUR TOYS AND EQUIPMENT.

WHAT WILL THE FEDS DO ON THURSDAY? …LAGGING NEW CONSTRUCTION NOT HELPNG STRONG HOUSING MARKET AND JOB GROWTH!
NFO THAT HITS US WHERE WE LIVE…For the housing market to get ahead, we need more homes to get started, but that’s not happening fast enough. A recent study by the National Association of Realtors (NAR) noted that job market growth is powering a strong housing market, but it’s also linked to declines in new home starts. The study revealed that in 146 metro areas with big employment gains, new home construction is “underperforming.” The NAR’s chief economist explains, “as the labor market began to strengthen, homebuilding failed to keep up.” This “lagging new home construction — especially single-family — has kept available inventory far below balanced levels.”
The NAR study also noted that low inventory has been a persistent problem in recent years. Home builders, however, should be eager to pick up the slack, as another study reported new homes are selling at their highest rate since February 2007, before the financial crisis. Oh, well, at least consumers, though cautious, remain upbeat, according to Fannie Mae’s new monthly Home Purchase Sentiment Index (HPSI). Its first reading shows respondents a bit concerned about rising mortgage rates and unstable economic conditions. But they’re also optimistic about the job market and their own household finances, so they aren’t turning away from the housing market.
>> Review of Last Week
WAITING UP… The theme for the holiday-shortened trading week was, “let’s wait and see if the Fed raises rates September 17, before we decide whether the bulls or the bears will prevail.” It’s this kind of mindset that results in the ton of volatility we’ve been seeing on Wall Street. The prior week, the Fed waiting game sent stock prices down, but last week, waiting sent the markets up. All three major indexes scored solid weekly gains, though it’s hard to say this shows investors feel positive. The fact is, with everyone fixated on this week’s Federal Reserve meeting, analysts expect the markets will remain volatile right up to the policy statement Thursday at 2 p.m..
After that, who knows? Meanwhile, we can all reflect on last week’s small grouping of economic data. Initial Unemployment Claims stayed under 300,000, dropping for the week by 6,000, to 275,000, while Continuing Unemployment Claims came in at a not-too-shabby 2.260 million. But the preliminary Michigan Consumer Sentiment read for September plummeted to 85.7, its lowest level in a year, and a huge 6.7% monthly drop from the final 91.9 measure for August. Observers think this reflects consumer reaction to the crazy stock market. The Producer Price Index (PPI) showed wholesale price inflation went nowhere in August, which might give the Fed pause.
The week ended with the Dow UP 2.1%, to 16433; the S&P 500 UP 2.1%, to 1961; and the Nasdaq UP 3.0%, to 4822.
In spite of Friday’s stock rally, bonds by and large held up, with Treasuries enjoying their own surge. The 30YR FNMA 4.0% bond we watch finished the week down .07, at $106.08. National average fixed mortgage rates were virtually unchanged according to Freddie Mac’s Primary Mortgage Market Survey for the week ending September 10. Remember, mortgage rates can be extremely volatile, so check with your mortgage professional for up to the minute information.
DID YOU KNOW?… A leading provider of data to the mortgage market reports that total home equity in July grew by almost $1 trillion, reaching its highest level since 2007. It is now 2.5 times bigger than it was at the end of 2011.
>> This Week’s Forecast
RETAIL UP, HOUSING STARTS DOWN, INFLATION MILD, SO WHAT WILL THE FED DO?… What will the Fed’s September FOMC Rate Decision be? We get the answer on Thursday. Most economists still say the central bank won’t start hiking rates until end of year, but the truth is, no one knows. The economy keeps giving mixed signals. Retail Sales are forecast to grow slower in August. Housing Starts should be down, Building Permits up. Overall Consumer Price Index (CPI) inflation is expected to contract, with Core CPI barely going up. The Fed wants to see inflation at 2% before raising rates.
>> The Week’s Economic Indicator Calendar
Weaker than expected economic data tends to send bond prices up and interest rates down, while positive data points to lower bond prices and rising loan rates.
Economic Calendar for the Week of Sep 14 – Sep 18
| Date | Time (ET) | Release | For | Consensus | Prior | Impact |
| Tu Sep 15 |
08:30 | Retail Sales | Aug | 0.3% | 0.6% | HIGH |
| Tu Sep 15 |
08:30 | NY Empire Manufacturing Index | Sep | 0.3 | -14.9 | Moderate |
| Tu Sep 15 |
09:15 | Industrial Production | Aug | -0.2% | 0.6% | Moderate |
| Tu Sep 15 |
09:15 | Capacity Utilization | Aug | 77.8% | 78.0% | Moderate |
| Tu Sep 15 |
10:00 | Business Inventories | Jul | 0.1% | 0.8% | Moderate |
| W Sep 16 |
08:30 | Consumer Price Index (CPI) | Aug | -0.1% | 0.1% | HIGH |
| W Sep 16 |
08:30 | Core CPI | Aug | 0.1% | 0.1% | HIGH |
| W Sep 16 |
10:30 | Crude Inventories | 9/12 | NA | 2.570M | Moderate |
| Th Sep 17 |
08:30 | Initial Unemployment Claims | 9/12 | 275K | 275K | Moderate |
| Th Sep 17 |
08:30 | Continuing Unemployment Claims | 9/5 | 2.254M | 2.260M | Moderate |
| Th Sep 17 |
08:30 | Housing Starts | Aug | 1.160M | 1.206M | Moderate |
| Th Sep 17 |
08:30 | Building Permits | Aug | 1.159M | 1.119M | Moderate |
| Th Sep 17 |
10:00 | Philadelphia Fed Index | Sep | 6.5 | 8.3 | HIGH |
| Th Sep 17 |
14:00 | FOMC Rate Decision | 9/17 | 0%-0.25% | 0%-0.25% | HIGH |
| F Sep 18 |
10:00 | Leading Economic Indicators (LEI) | Aug | 0.2% | -0.2% | Moderate |
>> Federal Reserve Watch
Forecasting Federal Reserve policy changes in coming months… The majority of economists still don’t see a rate hike coming out of this week’s FOMC meeting, but a growing majority do expect a small rise in December. Note: In the lower chart, a 23% probability of change is an 77% certainty the rate will stay the same.
Current Fed Funds Rate: 0%–0.25%
| After FOMC meeting on: | Consensus |
| Sep 17 | 0.00%-0.25% |
| Oct 28 | 0.00%-0.25% |
| Dec 16 | 0.25%-0.50% |
Single Family Construction has risen to an 8-year high, NAHB forecasts continued Acceleration!
INFO THAT HITS US WHERE WE LIVE…Home builders are building plenty of doors, sending single family construction spending up 2.1% in July over June, and up 15.8% over a year ago. In fact, single family spending was the leading driver of total private residential construction spending in July. Single family starts rose 12.9% to a 782,000 annual rate, an 8-year high and the National Association of Home Builders (NAHB) is forecasting single family spending will accelerate through the rest of this year. The NAHB’s chairman noted, “Our builders are reporting more confidence in the market and are stepping up production of single family homes as a result.”
The Fed’s latest Beige Book on economic conditions told us home sales and home prices headed up in all 12 Federal Reserve Districts. But construction activity was mixed and inventories continue to decline or stay flat. However, the overall residential outlook was positive, with the majority of Districts expecting the increased residential activity to continue. Freddie Mac’s August Insight & Outlook report says that 2015 should be the best year yet, as their annual home sales projection soared to 5.73 units. The Mortgage Bankers Association’s Weekly Applications Survey pegged their Purchase Index at its highest level since July, and 25% higher than a year ago.
SUMMER’S OVER… No one comes to Wall Street for fun in the sun, but everyone has a good time watching their investments go up. Traders enjoyed that sort of entertainment for most of the warm season, but the week before Labor Day the summer fun ended. The five-day roller coaster ride ended with the three major stock indexes posting their second largest weekly losses of the year. China’s economic slowdown didn’t help, but Friday’s jobs report sent stocks down with a thud. The 173,000 new Nonfarm Payrolls for August was on the low side, but good Hourly Earnings growth and a 5.1% Unemployment Rate may encourage the Fed to raise rates later this month.
However, those central bankers may want to take a closer look at this economic recovery. The ISM manufacturing index slipped to 51.1 in August, still signaling expansion above 50, but just barely. The ISM services index was way higher, at 59.0, though that too had slipped for the month. But let’s get positive. Productivity increased at a 3.3% annual rate in the second quarter, a nice upward revision from the prior 1.3% estimate. Initial Unemployment Claims have now come in under 300,000 for 31 weeks in a row, while Continuing Unemployment Claims dropped to 2.27 million. But the July Trade Deficit was $41.9 billion, $7.9 billion bigger than a year ago. Ugh.
The week ended with the Dow down 3.2%, to 16102; the S&P 500 down 3.4%, to 1921; and the Nasdaq down 3.0%, to 4684.
Stocks may have tanked, but bonds only had an OK week, thanks to investor concerns over a Fed rate hike in September. The 30YR FNMA 4.0% bond we watch finished the week up .04, at $106.15. Freddie Mac’s Primary Mortgage Market Survey for the week ending September 3 showed national average fixed mortgage rates up a tick. This was put to “another week with lots of volatility on essentially no new information.” Remember, mortgage rates can be extremely volatile, so check with your mortgage professional for up to the minute information.
DID YOU KNOW?… In their August Insight & Outlook report, Freddie Mac increased their mortgage originations estimate for 2015 to $1.45 trillion.
>> This Week’s Forecast
JOBLESS CLAIMS UNDER CONTROL, JUST LIKE WHOLESALE PRICES… Not much to look after during our first week back from the summer. The four days will have us checking if Initial Unemployment Claims remain under the 300,000 threshold. Analysts predict they will. The Producer Price Index (PPI) is forecast to show wholesale price inflation is also under control, contracting in August. If this keeps consumer prices down, the Fed may delay hiking rates, as they first want to see inflation up around 2%.
All financial markets were closed Monday September 7 for the Labor Day holiday.
>> The Week’s Economic Indicator Calendar
Weaker than expected economic data tends to send bond prices up and interest rates down, while positive data points to lower bond prices and rising loan rates.
Economic Calendar for the Week of Sep 7 – Sep 11
| Date | Time (ET) | Release | For | Consensus | Prior | Impact |
| Th Sep 10 |
08:30 | Initial Unemployment Claims | 9/5 | 275K | 282K | Moderate |
| Th Sep 10 |
08:30 | Continuing Unemployment Claims | 8/29 | 2.257M | 2.257M | Moderate |
| Th Sep 10 |
11:00 | Crude Inventories | 9/5 | NA | 4.670M | Moderate |
| F Sep 11 |
08:30 | Producer Price Index (PPI) | Aug | -0.1% | 0.2% | Moderate |
| F Sep 11 |
08:30 | Core PPI | Aug | 0.1% | 0.3% | Moderate |
| F Sep 11 |
10:00 | Univ. of Michigan Consumer Sentiment | Sep | 91.5 | 91.9 | Moderate |
| F Sep 11 |
14:00 | Federal Budget | Aug | NAB | -$128.7B | Moderate |
>> Federal Reserve Watch
Forecasting Federal Reserve policy changes in coming months… A majority of economists see a rate hike in December, while those predicting a September or October hike remain in the minority. Note: In the lower chart, a 19% probability of change is an 81% certainty the rate will stay the same.
Current Fed Funds Rate: 0%–0.25%
| After FOMC meeting on: | Consensus |
| Sep 17 | 0.00%-0.25% |
| Oct 28 | 0.00%-0.25% |
| Dec 16 | 0.25%-0.50% |
Probability of change from current policy:
| After FOMC meeting on: | Consensus |
| Sep 17 | 19% |
| Oct 28 | 36% |
| Dec 16 | 53% |
New Home Sales Avg. Fastest Sales Pace Since 2008 but China’s Economy and Interest Rates A Concern!
We certainly need no lengthy explanations concerning what’s doing in the new home market. In July new single-family home sales headed up 5.3%, to a 507,000 unit annual rate, and are now up 25.8% over a year ago. These sales cooled off in June, but looking at the past year, new home sales averaged their fastest sales pace since 2008. Consequently, inventories gained by 4,000, yet the months’ supply dropped from 5.3 in June to 5.2 in July. That faster selling pace gives builders a nice opportunity to step up construction activity and inventories. Remember, new home sales are still well below historic levels.
Meanwhile, the Case-Shiller Home Price index edged up 1.0% in June and now stands 4.5% ahead of a year ago. Prices are up in all 20 major metro areas the index tracks. The Federal Housing Finance Agency (FHFA) index of prices for homes financed with conforming mortgages went up 0.2% in June and registered a 4.5% hike over a year ago. For those questioning existing home sales, what Pending Home Sales did in July provided a nice short answer. This measure of contracts signed on existing homes went up 0.5% for the month, following its 1.7% dip in June. That dip means existing home sales may slip in August, but they gained almost 10% the three prior months.
Check this out. The Dow Jones Industrial Average drops almost 600 points Monday, then sinks another 34 Tuesday. Wednesday it shoots UP over 600 points, followed by an almost 400 point hike on Thursday. Friday ends flat after all the tumult, leaving a modest weekly gain for the Dow and the broadly based S&P 500, but a bigger boost for the tech-heavy Nasdaq. What caused this whirlwind of volatility? Analysts put it to investor uncertainty about China’s troubled economy, plus worries over when the Fed might start raising interest rates. The central bankers met at Jackson Hole, but comments from officials were hard to interpret.
U.S. economic data painted the now familiar picture of a plodding recovery. Positive moves included the housing reports covered above and a 2% gain in Durable Goods Orders for July. The best news was the second estimate of GDP for the second quarter, which had the economy growing at a 3.7% annual rate. Personal Income and Spending were up in July, both good reads, and Core PCE Prices went up just 0.1%. This is bad news to the Fed, which wants to see higher inflation before raising rates. University of Michigan Consumer Sentiment slipped in July, but this contrasted sharply with the Consumer Confidence Index, which hit a 6-month high in August!
The week ended with the Dow UP 1.1%, to 16643; the S&P 500 UP 0.9%, to 1989; and the Nasdaq UP 2.6%, to 4828.
Bonds had a mixed week, with investors buying because of worries over China and selling over concerns a Fed rate hike will come soon. The 30YR FNMA 4.0% bond we watch finished the week down .05, at $106.11. National average fixed mortgage rates dipped to their lowest levels since May in Freddie Mac’s Primary Mortgage Market Survey for the week ending August 27. This was put to Chinese financial market instability. Remember, mortgage rates can be extremely volatile, so check with your mortgage professional for up to the minute information.
DID YOU KNOW?… A recent survey reports that out of 75.3 million millennials, age 18 to 29, 93% want to own a home in the near future.
Weaker than expected economic data tends to send bond prices up and interest rates down, while positive data points to lower bond prices and rising loan rates.
Economic Calendar for the Week of Aug 31 – Sep 4
| Date | Time (ET) | Release | For | Consensus | Prior | Impact |
| M Aug 31 |
09:45 | Chicago PMI | Aug | 54.7 | 54.7 | HIGH |
| Tu Sep 1 |
10:00 | ISM Index | Aug | 52.6 | 52.7 | HIGH |
| W Sep 2 |
08:30 | Productivity-Rev. | Q2 | 2.7% | 1.3% | Moderate |
| W Sep 2 |
08:30 | Unit Labor Costs-Rev. | Q2 | -0.8% | 0.5% | Moderate |
| W Sep 2 |
10:30 | Crude Inventories | 8/29 | NA | -5.452M | Moderate |
| W Sep 2 |
14:00 | Fed’s Beige Book | Sep | NA | NA | Moderate |
| Th Sep 3 |
08:30 | Initial Unemployment Claims | 8/29 | 273K | 271K | Moderate |
| Th Sep 3 |
08:30 | Continuing Unemployment Claims | 8/25 | 2.261M | 2.269M | Moderate |
| Th Sep 3 |
08:30 | Trade Balance | Jul | -$43.1B | -$43.8B | Moderate |
| Th Sep 3 |
10:00 | ISM Services | Aug | 58.4 | 60.3 | Moderate |
| F Sep 4 |
08:30 | Average Workweek | Aug | 34.6 | 34.6 | HIGH |
| F Sep 4 |
08:30 | Hourly Earnings | Aug | 0.2% | 0.2% | HIGH |
| F Sep 4 |
08:30 | Nonfarm Payrolls | Aug | 217K | 215K | HIGH |
| F Sep 4 |
08:30 | Unemployment Rate | Aug | 5.2% | 5.3% | HIGH |
>> Federal Reserve Watch
Forecasting Federal Reserve policy changes in coming months… A growing minority of economists see a rate hike in September or October, while a slim majority expect it in December. Note: In the lower chart, a 28% probability of change is a 72% certainty the rate will stay the same.
64.2% of Millennials Put Down Less than 20%

Digital Risk recently polled Millennials about the housing market. Among their findings was the fact that nearly two-thirds of the generation who have recently purchased a home, have done so with less than 20% down; with 36% putting down less than 5%!
Here is a graph detailing the results:

This means that more and more American’s between the ages of 18 and 34 stopped paying their landlord’s mortgage and started building their own family’s wealth.
Millennials aren’t the only ones taking advantage of lower down payments.
The Federal Reserve Bank of New Yorkfound that if the down payment required to purchase a home went from 20% to 5%, a renter’s Willingness To Pay (WTP) increased by 40%.

The problem is that thirty-six percent of Americans still think a 20% down payment isalways required when buying a home. Many renters may actually be able to enter the housing market…
View original post 149 more words
